The python of wall street Part 2
Or how how to create an ETL
Disclaimer:
This project is a eight parts project that I’ll leverage to have the opportunity to implement different technologies I want to explore.
You are welcome to re-use any part of this script. But I would not advise using it on the stock market with your money. If you do, I am in no way responsible for whatever may result of it.
part 1: extracting data and computing trend indicators
part 2: creating an ETL pipeline for data quality and centralization
part 3: creating a classification model
part 4: automatic retraining of the model
part 5: create apis to access the data
part 6: data visualization
part 7: create docker container for micro services architecture
part 8: process automation
Part 1: Or what is an ETL
ETL is a type of data integration that refers to the three steps :
- Extract : data is extracted from a source system.
- Transform : the extracted data are converted and transformed into a format fit for analysis.
- Load : the transformed data are reconciliated if coming from different sources and stored into a data warehouse.

The objective is to create one golden record containing all the needed features for further reliable analysis or model creation. As well as an optimized pipeline to ingest new data inside the data lake.
Part 2: Or what is features augmentation
Feature generation is the process of creating new features from one or multiple existing features, potentially for using in statistical analysis. This process adds new information to be accessible during the model construction and therefore hopefully result in more accurate model.
https://towardsdatascience.com/optimizing-feature-generation-dab98a049f2e
Therefore, the transform part of the pipeline will consist in creating more features to better understand the underlying behavior of the studied phenomenom and creating a model that will be better at discriminating between sales and buy opportunities or hold opportunities.
Part 3: Why do you need it
At some point, some external information, for instance tweet analysis or wether forecast could be intergrated in your analysis for stocks. And brining them together in one place for further analysis and patterns extraction can be a challenge. ETL process the heterogeneous data and make it homogeneous which in turn makes it seamless for data scientists and data analysts to analyze the data and derive business intelligence from it. It makes it easier to intergrate several sources (APIs, database, files…) in one consolidated repository.
Then, it is easier to use the master record for further reliable analysis, as it is considered as the best source of truth and most reliable source of informations compared to putting together one way or an other the data.
Moreover, it enables better operations by getting a more granular vision of the workflow for later developement and maintenance.
Then, the transform part allows a systematic and coherent data manipulation and features augmentation over time, ensuring better continuity of services
Part 4: Our pipeline
In part 1 all the indicators were computed on the fly and the results were presented in a raw way to the consumer via graphs and points on those graphs when the indicators advised whether to buy or sell shares.
The objective here is to formalize this pipeline, make it more rbust and resilient and enable training of machine learning models, taking the decision to buy or sell istead of a human being.
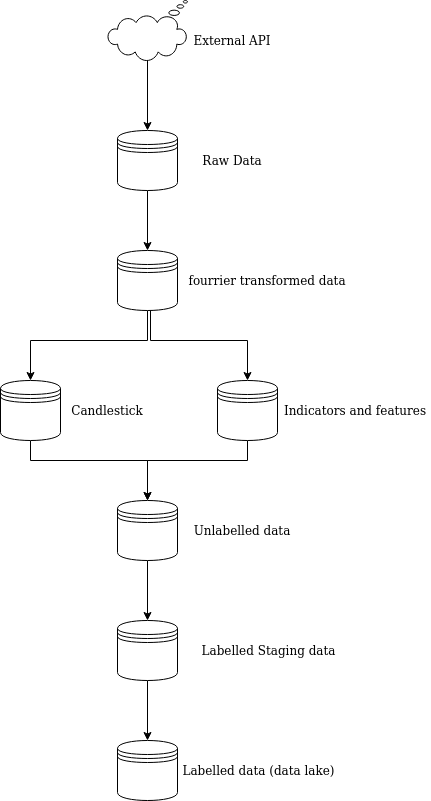
In the considered case, it is as follow:
- Extract the raw data from the iex_cloud api and store them in a staging (temporary database).
- Apply fourier transformed on the raw_data and store them in a staging database.
- Use the fourier transformed data to compute indicators for features creation and augmentation
- Compute the indicators from part 1: Bollinger bands, RSI, stochastique, ema 12 and ema 26, volume and number of trades
- For Bollingers, compute the difference between up and down as the squeeze is an indicator of the trend. Also compute the difference between emas, %K and %D for stochastic.
- Get the value for the indicator (1 for sell, -1 for buy, 0 for hold)
- Store the variations and indicators in a staging database
- Extract the candlestick patterns for the stocks as it also gives an indication about the trend (using the talib library here). A 0 would mean pattern not recognized and 1 meaning recognized pattern and store them in a staging database. - Then, the data in those two databases are joined into an other staging database to regroup all features. The junction is done using the id as key.
- Then, the data are labelled. The end goal being to train a model detecting the highest price and lowest price in order to buy or sell for the best prices and therefore making the biggest return on investment, the max and min values of price for each day for each stocks are labelled as 1 (max: sell) or -1 (min: buy) or else 0 (hold) and are inserted in one last staging table.
- Then, a script will asses whether or not the data in the staging table are very different from the one in the master record. If they are, it will will insert the data in the master record and retrain a classification model to compensate for drift. Otherwise, it will insert the data in the master record (more about this in part 4).
- Once the data are inserted in the master record, where data should only be read but in no way updated or deleted as it is the source of truth, data in the different staging tables will be deleted for better efficiency and data management. Also, it will prevent inserting dupplicates in the master when processing new data.
Conclusion
Having an ETL makes the data wrangling process more atomic and manageable. It also enables the creatin of a relevant and coherent dataset for later analytics or model training
The script for this project can be found here: https://github.com/elBichon/midas_project.github.io
Next Steps
The next step is to use those labelled data in the datalake to train a classification model to buy low, sell high or hold.
Références
https://towardsdatascience.com/optimizing-feature-generation-dab98a049f2e
https://www.springpeople.com/blog/data-warehousing-essentials-what-is-etl-tool-what-are-its-benefits/
https://www.investopedia.com/trading/candlestick-charting-what-is-it/
https://www.investopedia.com/articles/active-trading/062315/using-bullish-candlestick-patterns-buy-stocks.asp
https://en.wikipedia.org/wiki/Candlestick_pattern
